If you’ve ever opened a stock chart for the first time, you probably felt confused. So many lines, red and green candles, strange indicators — it can feel overwhelming.
But here’s the truth: Once you understand the basics, charts become much easier to read.
Learning How to Read Stock Charts helps you understand market psychology — who is buying, who is selling, and where price may move next. Whether you’re investing in Indian stocks like Reliance, TCS, or HDFC Bank, chart reading can help you make smarter decisions.
In this beginner-friendly guide, I’ll simplify:
- Candlestick charts
- Moving averages
- Support and resistance
No complicated jargon. Just practical explanations.
What Is a Stock Chart?
A stock chart is simply a visual representation of a stock’s price movement over time.
It mainly shows three things:
- Price – At what level the stock is trading
- Time – 1 minute, 1 hour, 1 day, 1 week, etc.
- Volume – How many shares were traded
Types of Stock Charts
1. Line Chart
The simplest chart. It connects closing prices with a line. Good for long-term investors.
2. Bar Chart
Shows open, high, low, and close prices. Slightly more detailed.
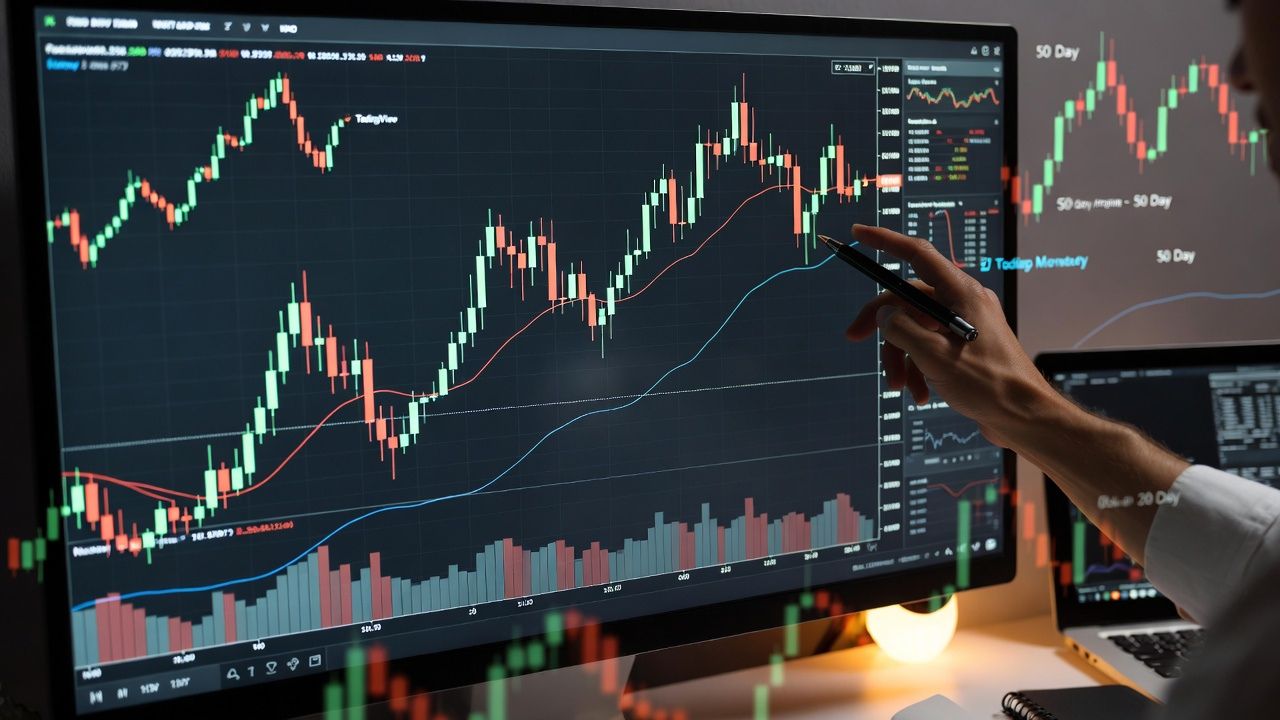
3. Candlestick Chart (Most Popular)
This is the most commonly used chart in technical analysis. It visually shows price movement in a very clear way.
For beginners learning How to Read Stock Charts, candlestick charts are the best place to start.
Understanding Candlestick Charts (With Example)
What Is a Candlestick?
Each candlestick shows price movement for a specific time period (like 1 day).
A candlestick has:
- Body – The thick part
- Wicks (Shadows) – Thin lines on top and bottom
Green vs Red Candle
- Green candle → Price closed higher than it opened (bullish)
- Red candle → Price closed lower than it opened (bearish)
Practical Example (Indian Market Context)
Imagine Reliance Industries stock moves:
- Opens at ₹2400
- Goes up to ₹2520
- Falls to ₹2380
- Closes at ₹2500
Since it closed above ₹2400, it forms a green candle.
What Big Body Means
If the body is large, it means strong buying (for green) or strong selling (for red).
What Long Wicks Mean
- Long upper wick → Sellers pushed price down from higher levels
- Long lower wick → Buyers pushed price up from lower levels
Bullish vs Bearish Candles
- Bullish candle = Buyers in control
- Bearish candle = Sellers in control
Once you understand this, you’ve already taken a big step toward mastering How to Read Stock Charts.
Moving Averages Made Simple
What Is a Moving Average?
A Moving Average (MA) is simply the average price of a stock over a certain number of days.
It smooths out price fluctuations and helps identify trends.
Common Moving Averages
- 50-Day Moving Average (50 MA) → Short to medium-term trend
- 200-Day Moving Average (200 MA) → Long-term trend
Simple Interpretation
- If price stays above 50 MA → Stock shows strength
- If price falls below 200 MA → Long-term weakness
Golden Cross & Death Cross
- Golden Cross → 50 MA crosses above 200 MA (bullish signal)
- Death Cross → 50 MA crosses below 200 MA (bearish signal)
Think of moving averages like a “trend filter.” They help you avoid buying in a falling market.
Support and Resistance Levels
This is one of the most powerful concepts in technical analysis.
What Is Support?
Support is a price level where buying interest is strong enough to stop the price from falling further.
Example:
If a stock repeatedly bounces from ₹100, that level becomes support.
What Is Resistance?
Resistance is a level where selling pressure stops price from rising further.
Example:
If price struggles to cross ₹150 multiple times, ₹150 becomes resistance.
Why Price Reverses
Markets move because of psychology:
- At support → Buyers think price is cheap
- At resistance → Sellers think price is expensive
Role Reversal Concept
If price breaks above resistance, that level can become new support.
This concept is widely used in Indian markets across NSE stocks.
How to Combine Everything (Simple Beginner Strategy)
Now let’s combine what we learned.
Here’s a basic educational strategy:
- Stock price above 50 MA (trend is positive)
- Price comes near support level
- A bullish (green) candle forms
- Volume increases
This setup suggests buyers may be stepping in again.
Important:
This is not financial advice. It’s just a learning example to help you understand How to Read Stock Charts properly.
Always practice before using real money.
Free Tools to Practice Technical Analysis
You don’t need expensive software.
Here are free tools beginners can use:
- TradingView (Free Version) – Excellent charts and indicators
- Investing.com Charts – Easy to access global and Indian stocks
- National Stock Exchange of India Website – Official stock charts
- Moneycontrol Charts – Beginner-friendly interface
Start by analyzing one stock daily. Even 15 minutes of practice improves your understanding.
Common Mistakes Beginners Make
1. Overtrading
Taking too many trades without proper setup.
2. Using Too Many Indicators
More indicators = more confusion. Keep it simple.
3. Ignoring Volume
Volume confirms strength. A breakout without volume is weak.
4. Emotional Decisions
Fear and greed ruin discipline. Always follow rules.
Remember, technical analysis works best when you stay patient.
Conclusion – How to Read Stock Charts
Learning How to Read Stock Charts is not about memorizing patterns. It’s about understanding price behavior.
Start simple:
- Learn candlesticks
- Add moving averages
- Identify support and resistance
Spend time observing charts of Indian stocks daily. The more screen time you get, the clearer patterns become.
Chart reading is a skill — and like any skill, it improves with practice.
FAQ’s – How to Read Stock Charts
1. How to read stock charts for beginners?
Start with candlestick charts. Learn what green and red candles mean, understand support and resistance levels, and use a simple moving average like the 50-day MA to identify trend direction.
2. What is the best chart for beginners?
Candlestick charts are best for beginners because they clearly show price movement, buying pressure, and selling pressure.
3. What is support and resistance in simple words?
Support is a price level where buyers stop the price from falling. Resistance is a level where sellers stop the price from rising.
4. Are moving averages reliable?
Moving averages are useful for identifying trends, but they are lagging indicators. They work best when combined with price action and support/resistance.
5. Can I learn technical analysis for free?
Yes. Platforms like TradingView, Investing.com, NSE India, and Moneycontrol offer free charts where you can practice and learn technical analysis without spending money.
Read More :
Best Stock Market Apps in India 2026 – technixt.com